
We’ve all read the same old articles on measuring B2B digital marketing KPIs.
Which means that we all know that you need to measure the sessions on your website and look at elements such as which sources deliver traffic that converts at a high percentage.
But what about the KPIs that you don’t know about, that you aren’t reporting on and measuring? What do they tell you about the performance of your marketing? Here are six suggestions from us for KPI reporting you may not currently be looking at, which could make all of the difference.
Let’s start with a really meaty one that can become a crucial digital marketing KPI.
1 – Cost per lead and customer acquired, by campaign
If you know how much it costs you to acquire each lead that comes into your business then it can be much easier to set meaningful budgets and apportion those budgets to campaigns that are going to produce the highest value leads.
The sums involved here are very simple. You need to know how much your campaign cost, how many leads it generated and, if you want to take the equation further still, how many customers your campaign converted and how much these customers were worth to you in a given time frame.
Let’s look at an example below.
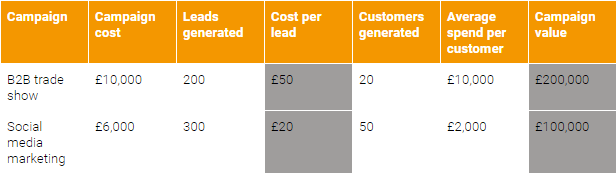
This shows the value of following the equation through to the end.
In the first three numerical columns we can see that it looks as though social media marketing is a star for us. We spend less on it and generate more leads, so our cost per lead is far lower, a very respectable £20 per lead. So we should spend more on social media advertising, right?
Well, no. If you look at the next three columns you can see that social media leads are much lower value to us, spending on average only £2,000. A trade show lead, by comparison, is extremely high value, and despite the fact that we generate less of them for more spend, trade show leads are worth twice as much as social media leads in overall revenue.
So, instead of spending more on social media advertising, should we stop it all together?
Well, again, not necessarily. In our example there isn’t enough data to make that decision. Both campaigns generate an attractive Return On Investment (ROI). Maybe there’s only this one trade show that we can attend each year. In which case continuing our spend on social media might make sense.
But if there is another trade show that we can attend then attending it instead of spending on social media might increase the revenue from these two example campaigns from £300,000 to £400,000. That’s a 33% revenue increase we wouldn’t have been able to action if we hadn’t looked at this KPI.
2 – Time in pipeline stage
This is crucial for spotting inefficiencies and hangups that delay sales and slow down your process.
If you use HubSpot then there is a specific report for this which you can add to your dashboard, where it will give you an updated view of how long leads spend at each stage of your sales pipeline every month.
If you have a ‘connect call’ or ‘initial contact’ stage, for example, followed by a ‘first call done’ stage, then the time in that first stage should really be very minor; ideally just one day.
Your team should always know what the next action is, so the time in the second stage should also be very short. If it is not then maybe the sales team are lacking materials from the marketing team to send out, or some similar hang up is delaying their follow-up. Whatever it is, as soon as you add the data to your KPI reports you can start to improve things.
We know of a company who had a ‘data collection’ stage that took, on average, over 70 days. As a result of measuring this KPI, they completely redesigned the process they used for data collection and vastly reduced the time spent in that stage.
3 – Conversion rates and form changes
A/B testing of pages and emails is a fairly well-established marketing practice nowadays, but don’t forget your forms.
You should be looking at the conversion rates of the pages your forms are placed on, making a change to your form and checking again. The change in conversion rate will highlight what impact your form change had and at times this can be significant.
You may already know that asking for a prospect’s telephone number can severely impact the conversion rate of your forms, for example, but every piece of information you request (and the way that you request it) can impact your conversion rate KPI.
Experiment with the fields you ask for and how you label those fields.
4 – Blog post conversions
If you’re using HubSpot then the blog analytics available enable you to do some fairly focused analysis on what exactly blogging is doing for you. Other platforms offer alternative metrics that you can use for this, so however you’re handling your blog you should be able to get some KPIs for it.
For instance, if you have forms placed within blogs themselves then you can look at which blog posts attract the most form submissions. If you have your conversion process set up to use CTAs to route blog readers to landing pages, where they submit a form then there are content marketing metrics to analyse.
Why not look at CTA clicks by blog post for example. Which blogs posts convert the highest amount of readers to your landing pages? Do these blog posts convert at a higher rate than others due to tone, style, design, CTA placement or topic? It’s time to do some A/B testing!
5 – Net Promoter Score (NPS)
NPS score is an incredibly valuable digital marketing KPI that few digital marketers in SMEs use.
Your NPS score indicates whether your customers will recommend you to others. Score 9 and above and they will recommend you. Score between 7-8 and your customers are ambivalent towards you. Score below 7 and your customers may be actively detracting from your growth.
To carry out an NPS survey of your customers you only need to ask one simple question: “on a scale of 1-10, how likely are you to recommend us to your family and friends?” You can adapt the question slightly if you think it’s not quite applicable to a B2B environment.
Tracking NPS over time indicates how delighted your customers are with you, and monitors the results of any customer engagement exercises you may currently be carrying out.
6 – Percentage increase from source after a campaign or strategy change
The problem with some KPI reports is that they remain static.
Marketing changes all of the time and it’s likely that your marketing changes regularly. It could be social media one month and trade shows the next. Your activity should dictate the KPI reporting you provide. (You can learn more about how to write great digital marketing reports here.)
For instance, if you have just completed a major social media marketing campaign or spent a month running a changed approach on social media, then your KPI report should feature specific mentions of what you did and what the KPI was. Hint: the KPI could well be looking at the percentage increase of traffic, leads or customers from the source you spent the most time on.
It’s time to get reporting on the KPIs that matter!
